Would you like to learn how to monitor web pages with free and open-source monitoring software called Zabbix? Well then, you are in the right place, because in this tutorial I will show you how to setup web monitoring on Zabbix from scratch using various examples!
Zabbix is not just for website monitoring, it can monitor virtually anything like Linux and Windows servers, VMware platform, Routers, and Switches, Databases, Docker containers, and more. Learn more about Zabbix on the official website.
Web monitoring in Zabbix is a pretty straightforward process. But what if you want to monitor hundreds or more websites in an automated manner? Unfortunately, this cannot be done using the out-of-the-box Zabbix functionality. There is no low-level discovery (LLD) for website monitoring.
However, Zabbix offers tools that can, with a little programming, automatically detect and monitor websites. Don’t worry, you don’t need to write any code, because I will share a template and script that I developed for dynamic website monitoring. With that template, it is enough to give a list of URLs (sitemap link, a path to a text file, macro with URLs separated by a semicolon ), and Zabbix will automatically create web checks for each URL.
But first things first, let me show you how to create a web scenario in Zabbix manually and how to configure alerts that will trigger when your website becomes unavailable.
Step 1: Install Zabbix monitoring system
Don’t have Zabbix installed? Don’t worry, I got you covered. You can install Zabbix in 10 minutes. Depending on your operating system (OS) preferences you can follow CentOS/RHEL, Ubuntu, Debian, Raspberry Pi OS (Rasbian) tutorial.
Zabbix installed and ready? Then, continue with the tutorial.
Step 2: Create a simple Zabbix Web scenario using a template
Web scenario is a key mechanism that enables web monitoring in Zabbix. A web scenario consists of one or more steps (HTTP requests) that are periodically executed in a predefined order.
You can create web scripts directly on the host, but this is not the best practice. It is better to create web scenarios in the template and then link them to the host. Let me show you how it’s done!
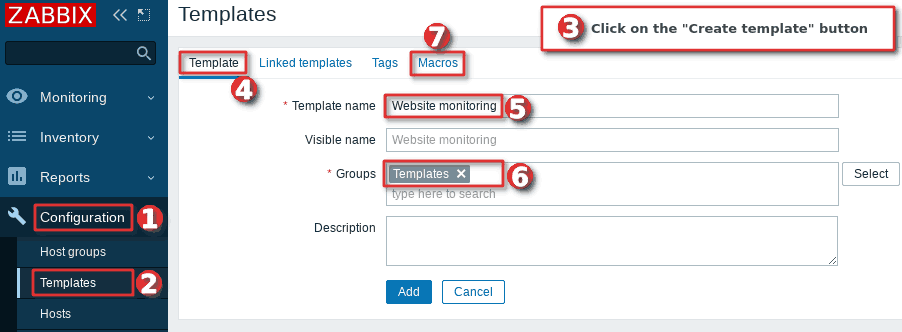
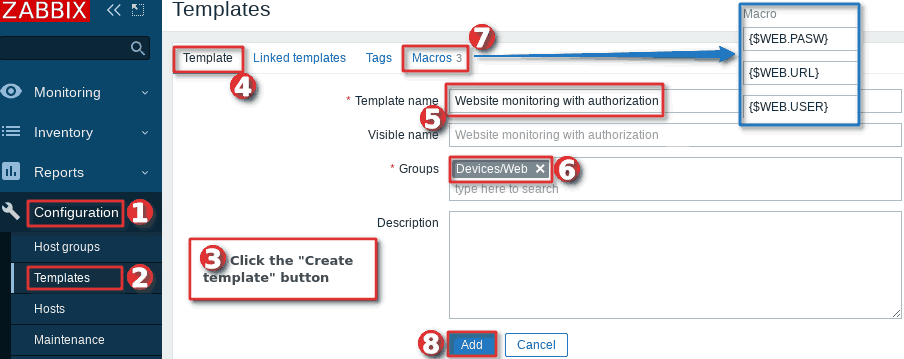
a) Create a Zabbix template for website monitoring
Navigate to the “Templates” under the “Configuration” section and click on the “Create template” button. Under the “Template” tab you need to define the “Template name” and the host group – “Groups“.
Next, switch to the “Macros” tab and create the macro {$WEB.URL}, but leave the value field blank for now. You will define a URL in that field later when you link the template with a host.
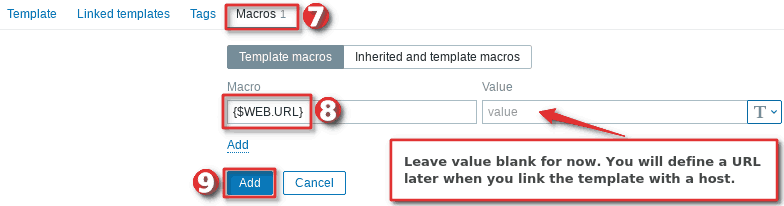
NOTE: You will later set the URL of the website you want to monitor in the {$WEB.URL} macro. And wherever that macro is used in the template, it will be translated into that URL. That way, you can use one template on multiple hosts and monitor different websites without changing the template.
Nice! Click the “Add” button to create the template and move to the next step.
b) Create a web scenario in the template
Now, go to the newly created template and click the “Create web scenario” button under the”Web scenarios” tab. Set name to “Website Health Check: {$WEB.URL}” and select the browser agent of your choice under the “Agent” dropdown.
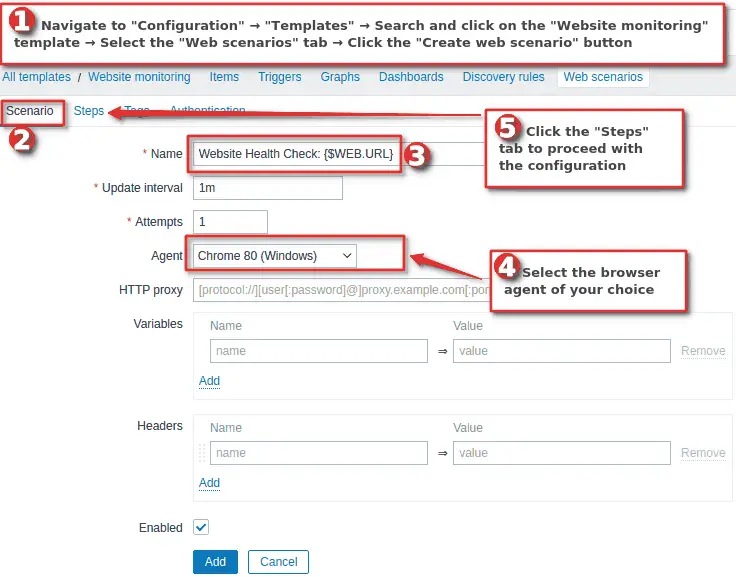
After that switch to the “Steps” tab and click on the little “Add” button to create your first step. A new window will appear in which you need to set the “Name” to “Website Availability“, “URL” to “{$WEB.URL}“, enable “Follow redirects“, and “Required status codes” to “200“. Basically, we are telling Zabbix that it must get code 200 if the page is working properly.
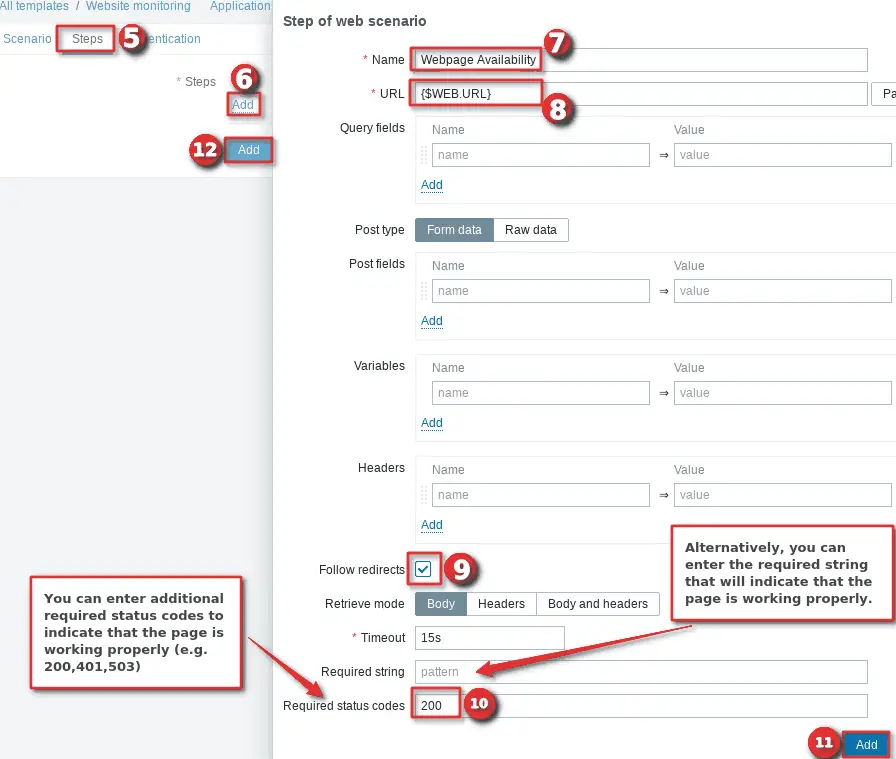
Now click that big “Add” button to create a step. And after the window closes, click the second “Add” button to create the web scenario.
And you’re done! You have created your first web scenario! Nice work!
Note that you can enter additional required status codes (comma separated) that will indicate that the page is working properly. In addition to the status code 200, I like to add 401, 403, 410, and 503 codes. Learn more about status codes on the IANA or Wikipedia.
| HTTP Status Codes | Description |
| 200 | OK – standard response for successful HTTP requests |
| 401 | Unauthorized – user does not have valid authentication credentials for the target resource |
| 403 | Forbidden – request contained valid data but does’t have the necessary permissions for a resource |
| 410 | Gone – indicates that the resource requested is no longer available and will not be available again (removed by the administrator). |
| 503 | Service Unavailable – usually this code is used to indicate that the website is down for maintenance |
b) Create a trigger (alarm) for the web scenario
If you want to receive notifications when your site is unavailable or slowing down, then you need to create Zabbix triggers. To do this, you need to update our Website Monitoring template by adding a new trigger.
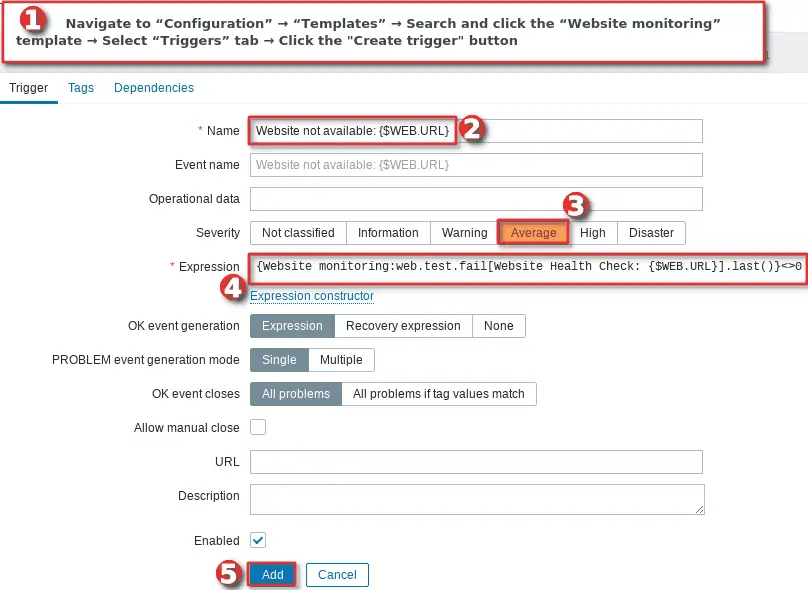
First, we will create a trigger that will check website availability every minute. Navigate to the “Configuration” → “Templates” → search and click the “Website monitoring” template → select the “Triggers” tab → click the “Create trigger” button.
Set trigger name to:
Website not available: "{$WEB.URL}"
Severity can be whatever you prefer. Add trigger expression using that little “Add” or manually as a text using this expression:
New syntax expression (Zabbix 5.4 and later)
last(/Website monitoring/web.test.fail[Website Health Check: {$WEB.URL}])<>0

Old syntax expression (Zabbix 5.2 and older)
{Website monitoring:web.test.fail[Website Health Check: {$WEB.URL}].last()}<>0
Note that you can replace the “last()” function with the “max(5m)” function if you would like to receive a notification only when the website is down for more than 5 minutes. Alarms can be spammy sometimes when using the “last” function so consider using “avg“, “max” or “min” functions (hysteresis).
Click that big “Add” button when you’re done configuring the trigger and you are done!
The previous trigger will alert you if our website is unavailable, but what if it is available but very very slow? We need another trigger that will alert us to such a problem. Let’s create that trigger! Just repeat the same procedure: navigate to “Configuration”→ “Templates”→ Search and click the “Website monitoring” template→ Select “Triggers” tab→ Click the “Create trigger” button.
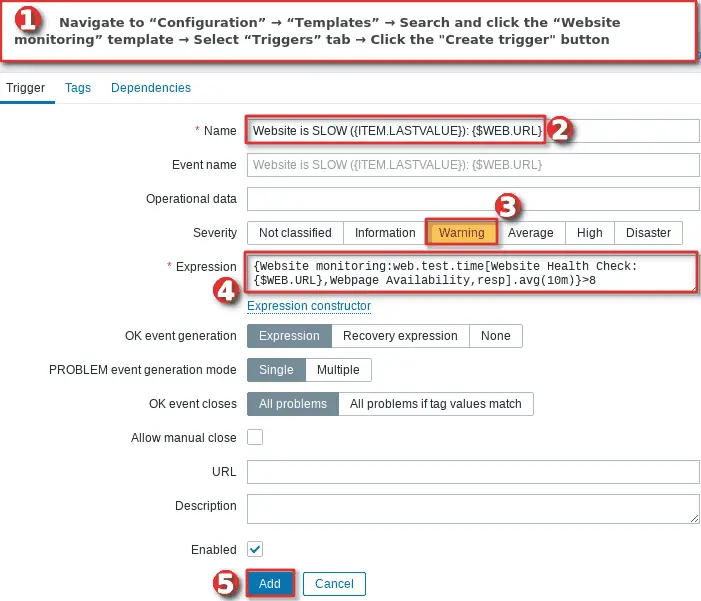
Set trigger name to:
Website is SLOW ({ITEM.LASTVALUE}): {$WEB.URL}
Severity can be whatever you prefer. Add trigger expression using that little “Add” or manually as a text using this expression:
New syntax expression (Zabbix 5.4 and later)
avg(/Website monitoring/web.test.time[Website Health Check: {$WEB.URL},Webpage Availability,resp],10m)>8

Old syntax expression (Zabbix 5.2 and older)
{Website monitoring:web.test.time[Website Health Check: {$WEB.URL},Webpage Availability,resp].avg(10m)}>8
Click that big “Add” button when you’re done configuring the trigger and thats it!
NOTE: Consider creating a new macro {$URL.SPEED} on the template and replacing 8 seconds with {$URL.SPEED} in trigger expression. This will be useful if you are planning to change that threshold often or if you have multiple sites with drastically different response times.
WELL DONE!
You created a simple web scenario in Zabbix using a template! Now you need to enable website monitoring by linking that template with the host and defining a URL within the macro!
Step 3: Enable Website monitoring on the host in Zabbix
As you may have noticed we are still not monitoring anything! Because we didn’t link the template to the host! Let’s do that!
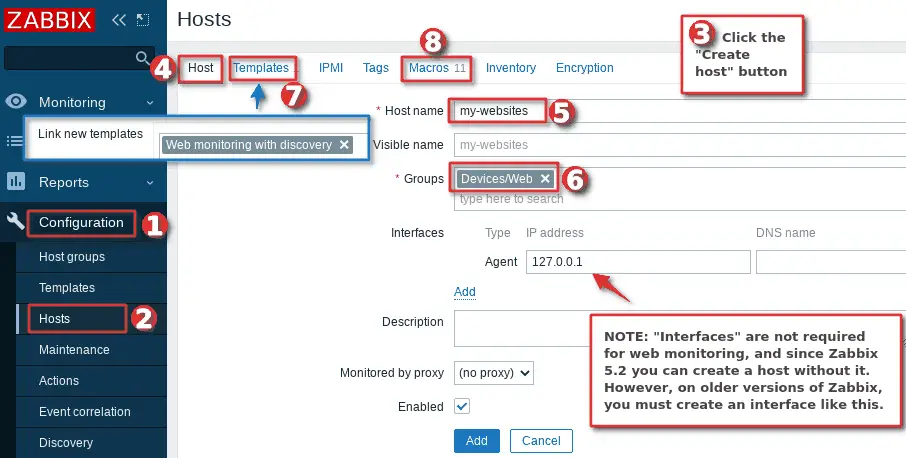
Navigate to the “Host” menu under the “Configuration” section and then click the “Create host” option to create a host in Zabbix. Define “Host name”, set something that will describe what you are monitoring. Create your group using the “Groups” field or use an existing one.
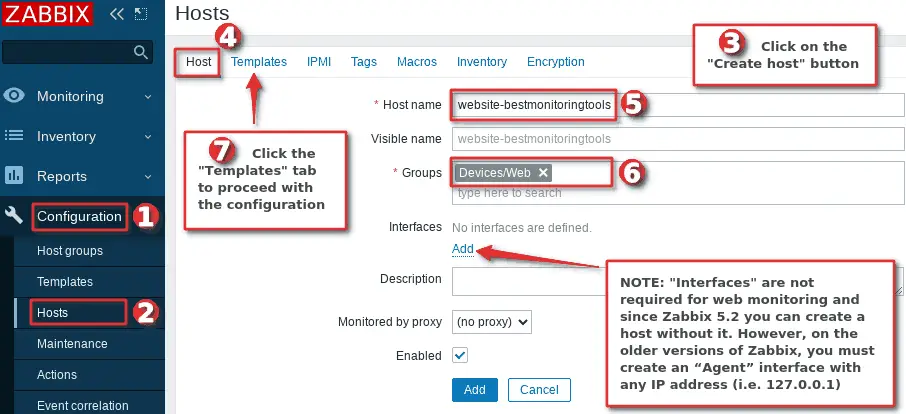
Don’t click that “Add” button yet! We need to link a template that we created in the previous step and configure {$WEB.URL} macro. Click the “Templates” tab and link the “Website monitoring” template using the “Link new templates” field.
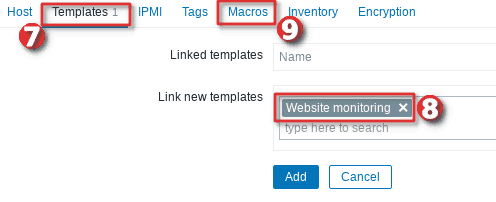
Switch to the “Macros” tab , click the “Change” for the macro “{$WEB.URL}” and set the URL of the website that you need to monitor in the value field of that macro.
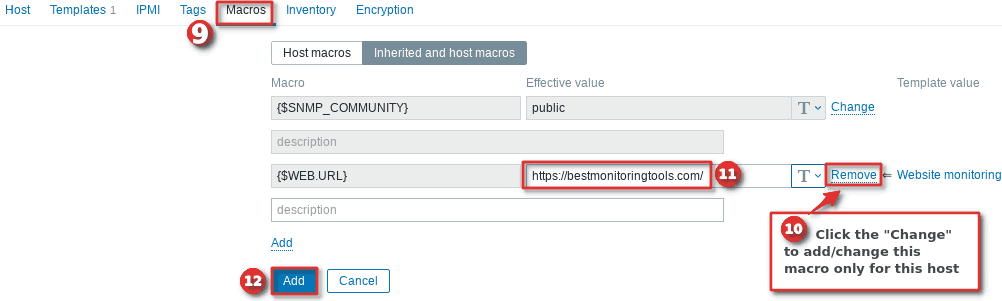
Press that add button and you’re done!
Step 4: Learn how to view web monitoring graphs
There are several ways to visualize data on Zabbix, but to simplify things, let’s see the default visualization for web scenarios. Navigate to “Monitoring”→ “Hosts”→ Search your host→ Click on the “Web” button→ and then click on your web scenario to view graphs.
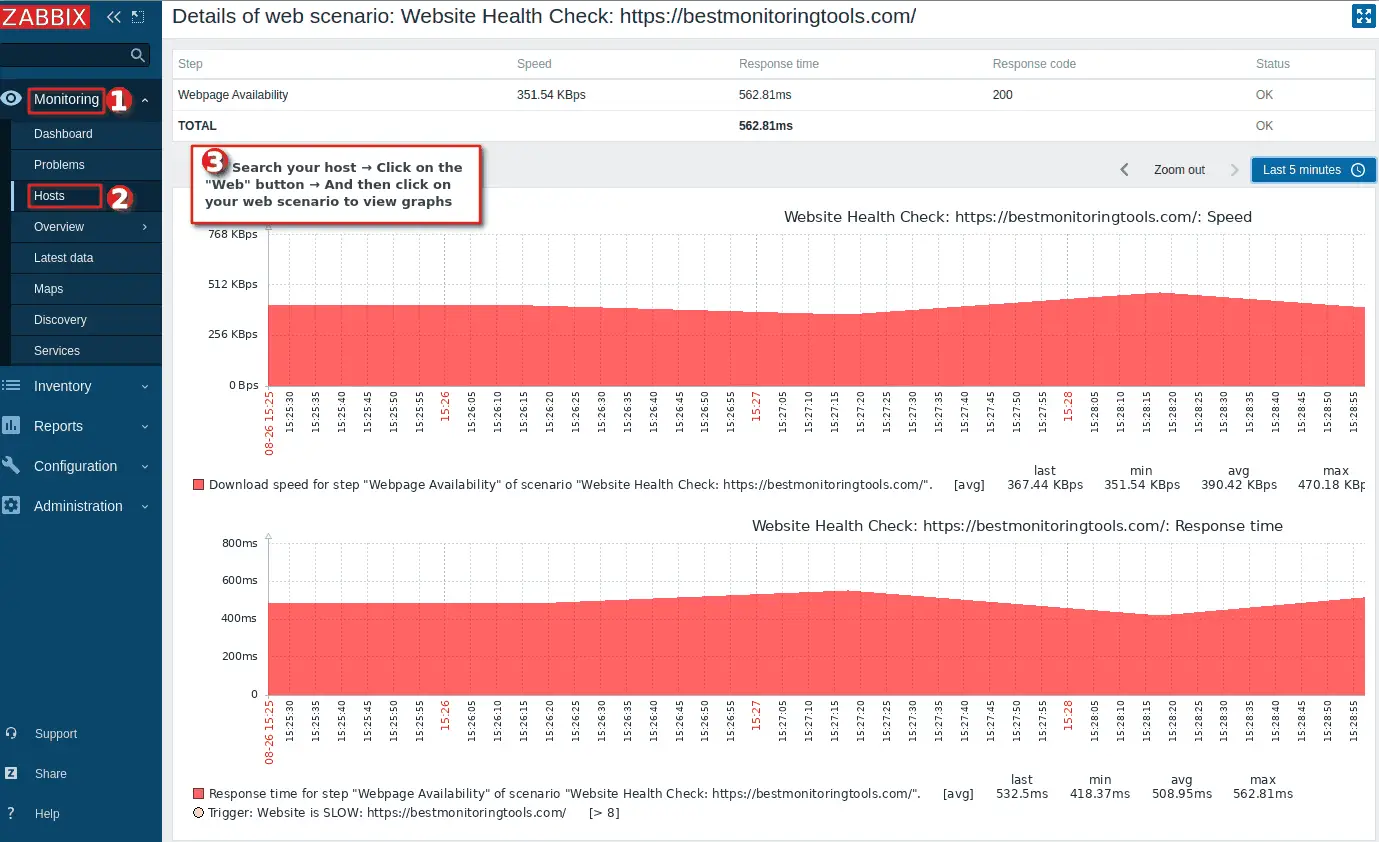
That’s it! Nice work!
CONGRATULATIONS!
You have successfully configured Web Monitoring in Zabbix!
No need to change anything else as other steps are optional.
CONTINUE TO LEARN MORE:
Configure Website monitoring with authorization
Automate web scenario and trigger creation
In the previous step, we have configured a simple web scenario that checks the unavailability or slowness of the website. And most of the time that’s all you’ll ever need. However, what if we want to test user authentication on the website? Well, we can configure that on Zabbix, and even more!
Let’s create a multi-step web scenario that will sign in to the website using credentials, click on the profile page, log out, and notify us if any of these steps fail.
We will use this WordPress blog as a example.
a ) Search for post fields in the login form
Before we continue, it is crucial to find out which post fields we need to use to successfully log in to the website using Zabbix. If you are also monitoring a WordPress website then you can skip this step because I have dug up all the post fileds for you.
However, if you want to know to extract post fields from the login form, then check out the instructions in the image below.
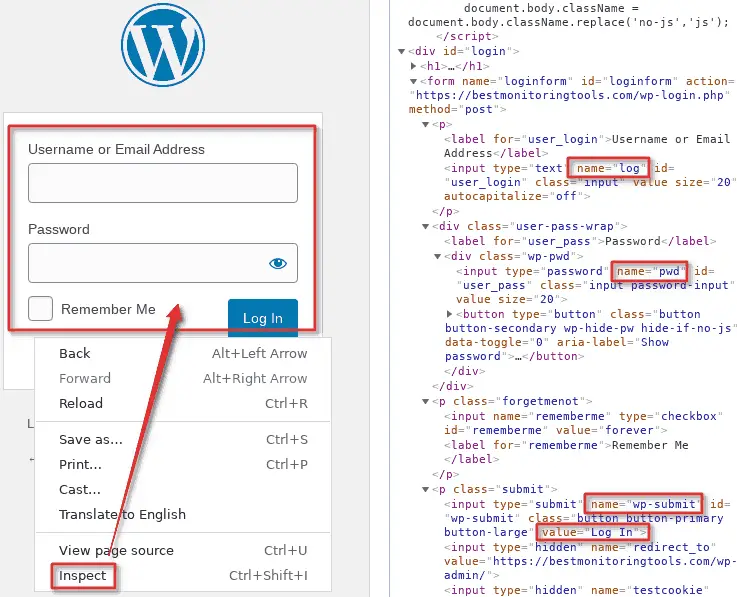
Basically, you need to use Chrome or Firefox inspect tool to find out user, password, and submit post fields:
| Post field Name | Post field Value |
| log | <website username> |
| pwd | <website password> |
| wp-submit | Log in |
b ) Create a Zabbix template for website monitoring with authorization
Creating web scenarios directly on the host is a bad practice so we will use a template.
Navigate to the “Templates” under the “Configuration” section and click on the “Create template” button. Under the “Template” tab you need to define the “Template name” and the host group under the “Groups” field. I will set the name to “Website monitoring with authorization” and “Groups” to “Devices/Web“.
Next, switch to the “Macros” tab and create macros: {$WEB.URL}, {$WEB.PASW}, and {$WEB.USER}, but leave the value fields blank for now. You will define a URL, username, and password values later when you link this template with a host.
Click the “Create template” button and proceed to the next step.
c ) Create multi-step web scenario on the Zabbix template
Now, go to the newly created template and click the “Create web scenario” button under the”Web scenarios” tab.Set name to “AdvanceWebsite Check (login, click, logout): {$WEB.URL}” and select the browser agent of your choice under the “Agent” dropdown.
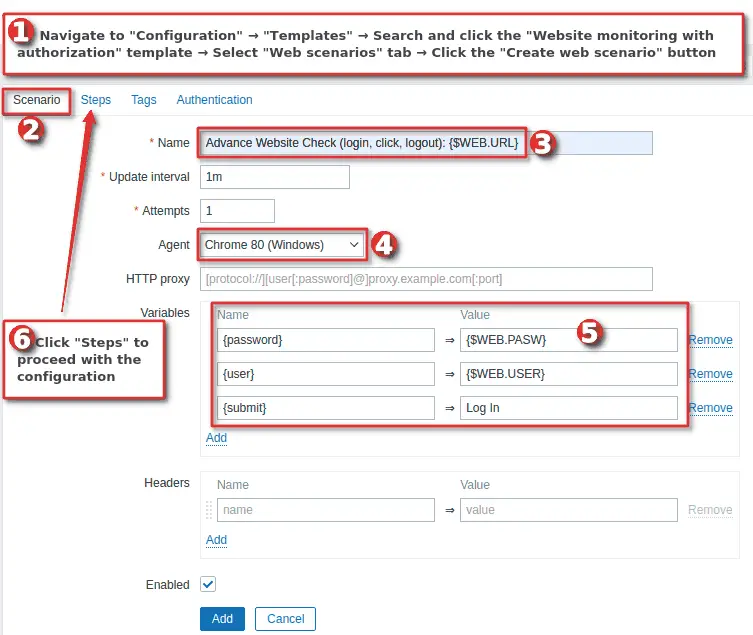
Since we are creating multiple web scenarios then it would be wise to set variables for username, password, and submit values. In this way, we can use these variables in as many steps as we want. In our case, we plan to define username and password later using macros so we will set macros instead of real credentials:
| Variable Name | Variable Value |
| {password} | {$WEB.PASW} |
| {user} | {$WEB.USER} |
| {submit} | Log In |
Web scenario step 1: Create “Login” web scenario
After that switch to the “Steps” tab and click on the little “Add” button to create your first step. A new window will appear in which you need to set the “Name” to “Login“, “URL” to “{$WEB.URL}/web-login.php” (this URL works only with WordPress).
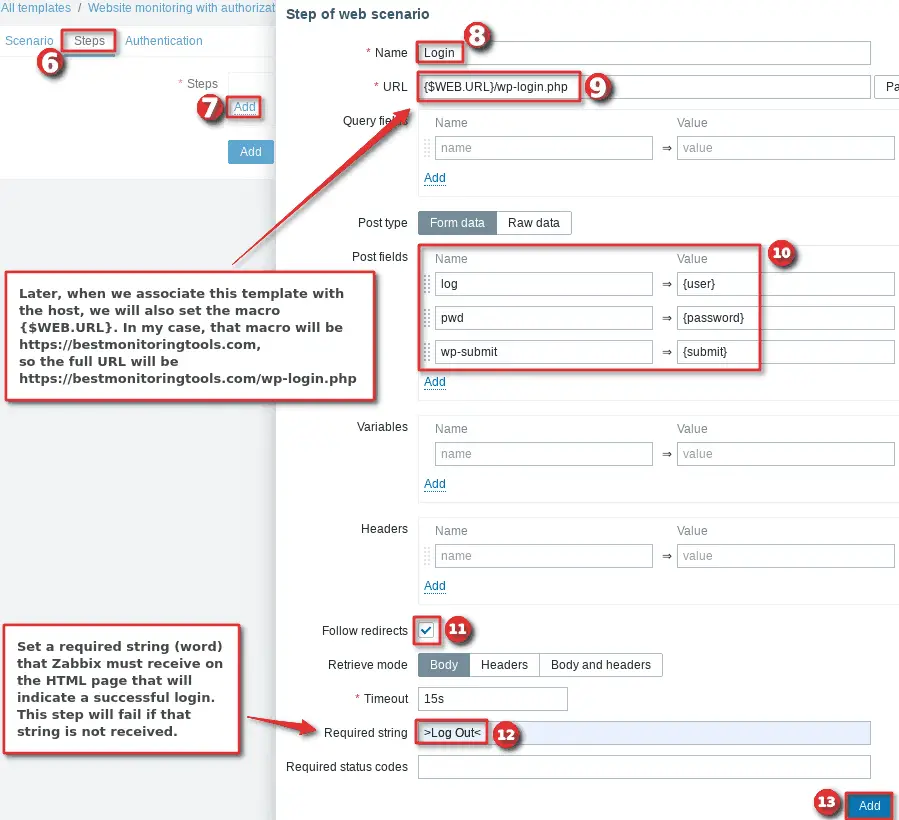
And now, we can associate the post field names that we got in the step “Search for mail field when signing in” with our newly created variables:
| Post field Name | Post field Value |
| log | {user} |
| pwd | {password} |
| wp-submit | {submit} |
Enable “Follow redirects” and set “Required string” to “>Log Out<” because if the login was successful “Log Out” button will appear on the page. You can find the string “>Log Out<” when viewing a page in HTML format using the Google / Firefox inspect tool.
Click the “Add” button at the bottom of the step window and go to the next step (do not click the “Add” button for the entire web scenario – we are not done yet!).
Web scenario step 2: Create “Click on profile” web scenario
Now we need to create a step that will open another webpage after the login to confirm that the website is alive and responsive. Set the “Name” to “Click on profile“, “URL” to “{$WEB.URL}/wp-admin/profile.php” (this URL will open user profile webpage on the WordPress).
Enable “Follow redirects“, and paste “Update Profile” into the “Required string” because if the webpage is successfully loaded the “Update Profile” button will appear on the page.
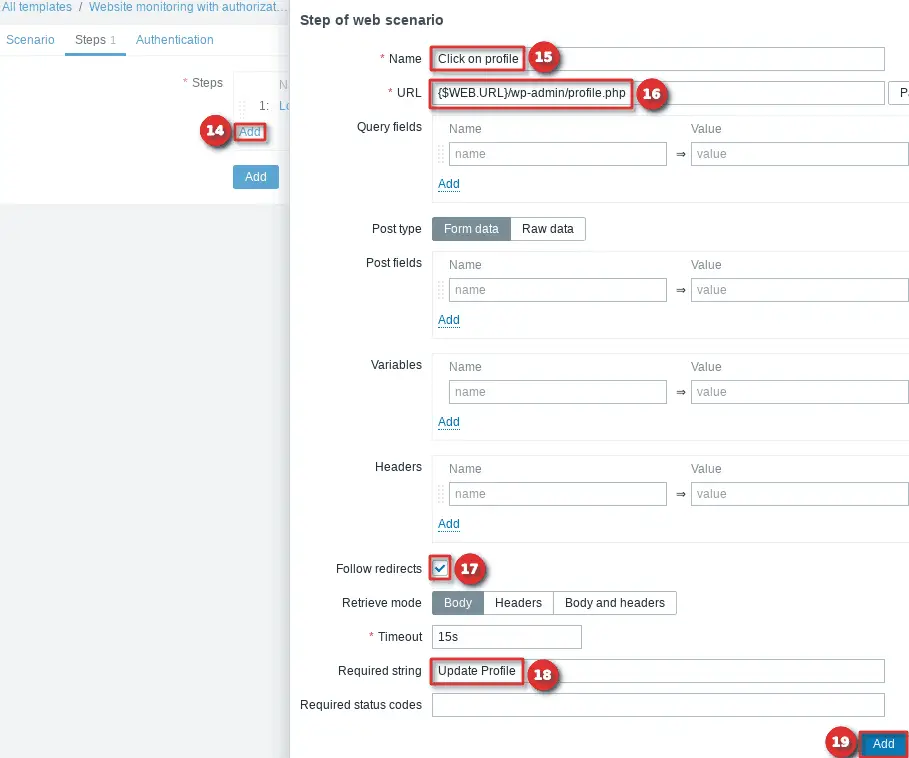
Click the “Add” button at the bottom of the step window and go to the next step (do not click the “Add” button for the entire web scenario – we have one more step left!).
Web scenario step 3: Create “Log out” web scenario
This is the last step, let’s create a scenario that will do a logout. Set the “Name” to “Logout“, “URL” to “{$WEB.URL}/wp-login.php?logedout=true” (this URL will logout a user from the WordPress website). Alternatively, you can use “Post fields”, but for simplicity, I will set the post fields directly in the URL by adding “?logedout=true”.
Enable “Follow redirects“, and paste “Username or Email Address” into the “Required string” because if the user is successfully logged out the “Username or Email Address” field will appear on the page.
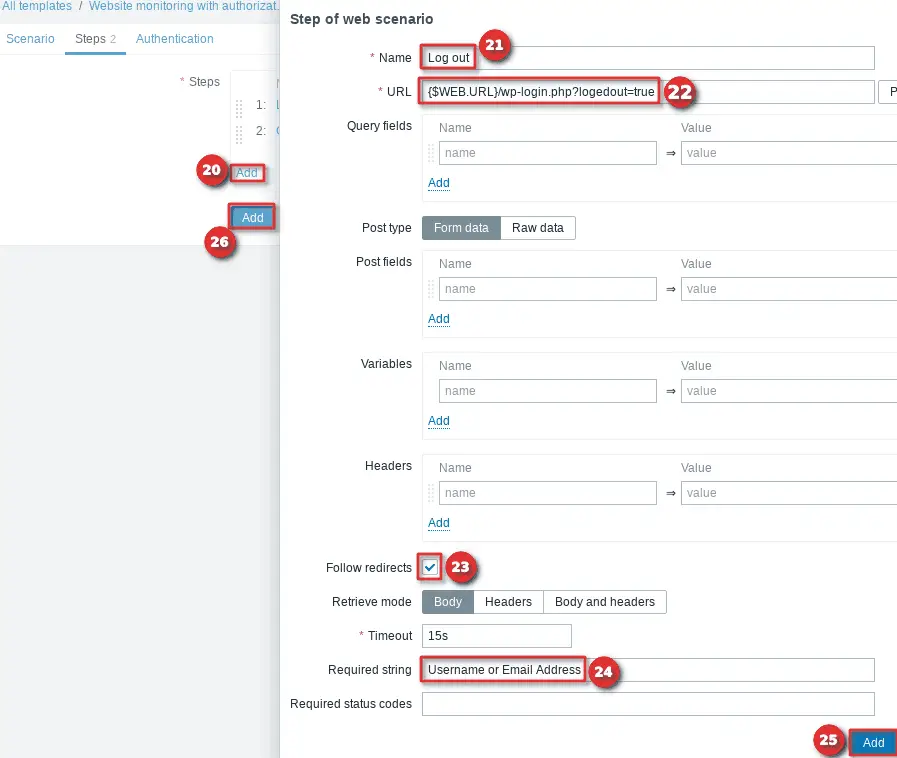
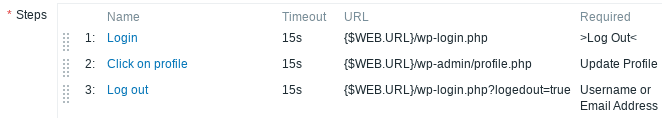
You can now click the “Add” button for the entire web scenario if all three web scenarios are displayed exactly as in the image below.
d ) Create a trigger for the advance web scenario
If you want to receive notifications when your site is unavailable or if user authorization fails, then you need to create Zabbix triggers. Update the “Website Monitoring with authorization” template by adding a new trigger. Navigate to “Configuration”→ “Templates”→ Search and click the “Website Monitoring with authorization” template→ Select “Triggers” tab→ Click the “Create trigger” button.
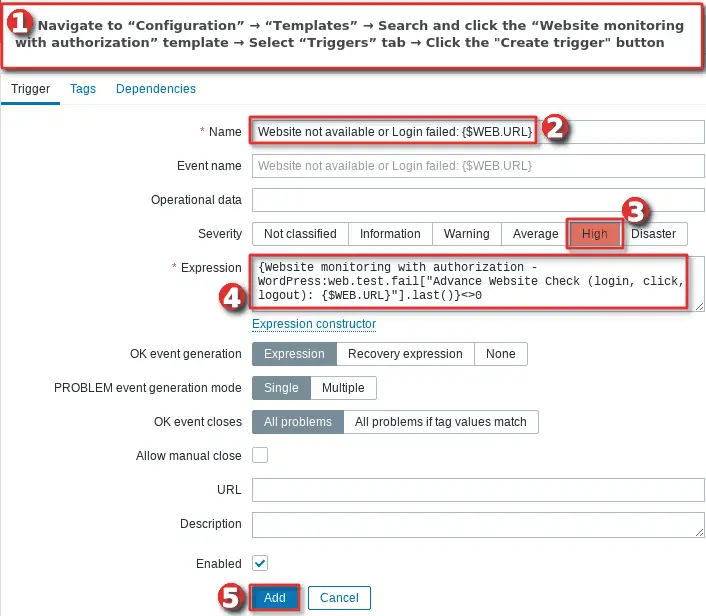
Set trigger name to:
Website not available or Login failed: {$WEB.URL}
Severity can be whatever you prefer. Add trigger expression using that little “Add” or manually as a text using this expression:
New syntax expression (Zabbix 5.4 and later)
last(/Website monitoring with authorization/web.test.fail["Advance Website Check (login, click, logout)"])<>0

Old syntax expression (Zabbix 5.2 and older)
{Website monitoring with authorization:web.test.fail["Advance Website Check (login, click, logout): {$WEB.URL}"].last()}<>0
Click that big “Add” button when you’re done configuring the trigger and thats it!
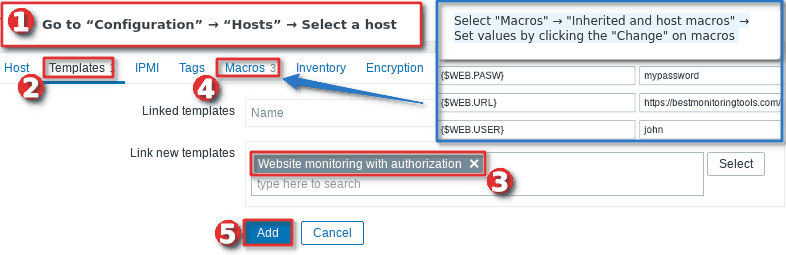
d ) Enable Website monitoring with authorization on the host in Zabbix
Use an existing host or create a new one just for the website monitoring like in the step “Step 3: Enable Website monitoring on the host in Zabbix” but set different template and macros.
Link the template “Website monitoring with authorization”, and under the “Macros” tab select the “Inherited and host macros” option and set values by clicking the “Change” on macros {$WEB.URL}, {$WEB.PASW}, and {$WEB.USER}.
Nice job! You have configured advanced website monitoring with authorization.
Step 6: Automate web scenario and trigger creation
You may have noticed that the process of creating web scenarios on Zabbix is slow and tedious. There is no automation, no low-level discovery (LLD)!
What if you want to monitor a couple of thousand pages in Zabbix? Unfortunately, to do that you would have to create it all manually unless you throw yourself into scripting. Luckily, there is no need for that, because I’ve already created a Zabbix script that automatically discovers and monitors web pages using a list of web page URL’s. The easiest way is to use a sitemap but you can also use a text file or manually enter a list of URLs within the macro.
But first thing first, let’s install some python modules that our script needs and tweak the Zabbix server configuration file.
a) Install py-zabbix python module
Install python 3, python-requests and python-setuptools:
# RHEL / CentOS / Oracle Linux / Rocky Linux
yum install -y python3 python3-requests python3-setuptools

                                 OR

# Ubuntu / Debian / Raspberry OS
sudo apt install python3 python3-requests  python3-setuptools
Install python-zabbix module:
# Install py-zabbix using pip3
sudo pip3 install py-zabbix

                                 OR

# Install py-zabbix from source if you don't want to use pip3
curl -o  py-zabbix-1.1.7.tar.gz https://files.pythonhosted.org/packages/c8/b1/5ecb05b542a78dd6d619c825740fc11b12cb2afd06b9c679129a5c795554/py-zabbix-1.1.7.tar.gz
tar -zxvf py-zabbix-* && cd py-zabbix-*/
python3 setup.py install
b) Download webmonitoring script
Download my script and put it in your Zabbix ExternalScripts directory. Don’t know the path of that directory? Use the Zabbix configuration file to find out where the Zabbix ExternalScripts directory is located:
grep "ExternalScripts=" /etc/zabbix/zabbix_server.conf
The output of the command should be similar to this:
# ExternalScripts=/usr/lib/zabbix/externalscripts # this is default
Now download my script to that directory:
curl -o /usr/lib/zabbix/externalscripts/webmonitoring.py https://bestmonitoringtools.com/dl/webmonitoring.py
And set executable permissions on the script:
chmod +x /usr/lib/zabbix/externalscripts/webmonitoring.py
c) Update Zabbix server configuration file
When monitoring a large number of websites Zabbix will generate an alarm “Zabbix HTTP poller processes more than 75% busy“. As a result, some polling data will be lost. To avoid this, you need to increase the number of HTTP pollers in the Zabbix server configuration file.
Open “zabbix_server.conf” file with command: “nano /etc/zabbix/zabbix_server.conf” and add (or change) these parameteres:
StartHTTPPollers=10
Also, the script will need more time to complete, therefore add (or change) the Timeout parameter and set it to 30 seconds:
Timeout=30
Save and exit file (ctrl+x, followed by y and enter). Learn more about the timeout parameter and what impact its change has on Zabbix in my old blog post.
In order to apply the new settings you need to restart the Zabbix server, so let’s do that:
systemctl restart zabbix-server
d) Download and import template
Now that we have the script in place, we need to set up a template that will use our script. Download the template “Web monitoring with discovery” and import it to Zabbix via frontend.
To do this, navigate to the “Templates” under the “Configuration” section and click the “Import” button, then select the downloaded template file and import it.
e) Create a host and configure macros (API credential, source of URLs etc.)
Almost done! Add a new host to Zabbix that will use our template and script to create all the triggers and graphs for each monitored website.
Create a host, link the “Web monitoring with discovery” template and use a similar setting as in the image below.
Don’t click the “Add” button yet! Now comes the important part – configure macros according to the instructions in the macro description. See my example in the image below.
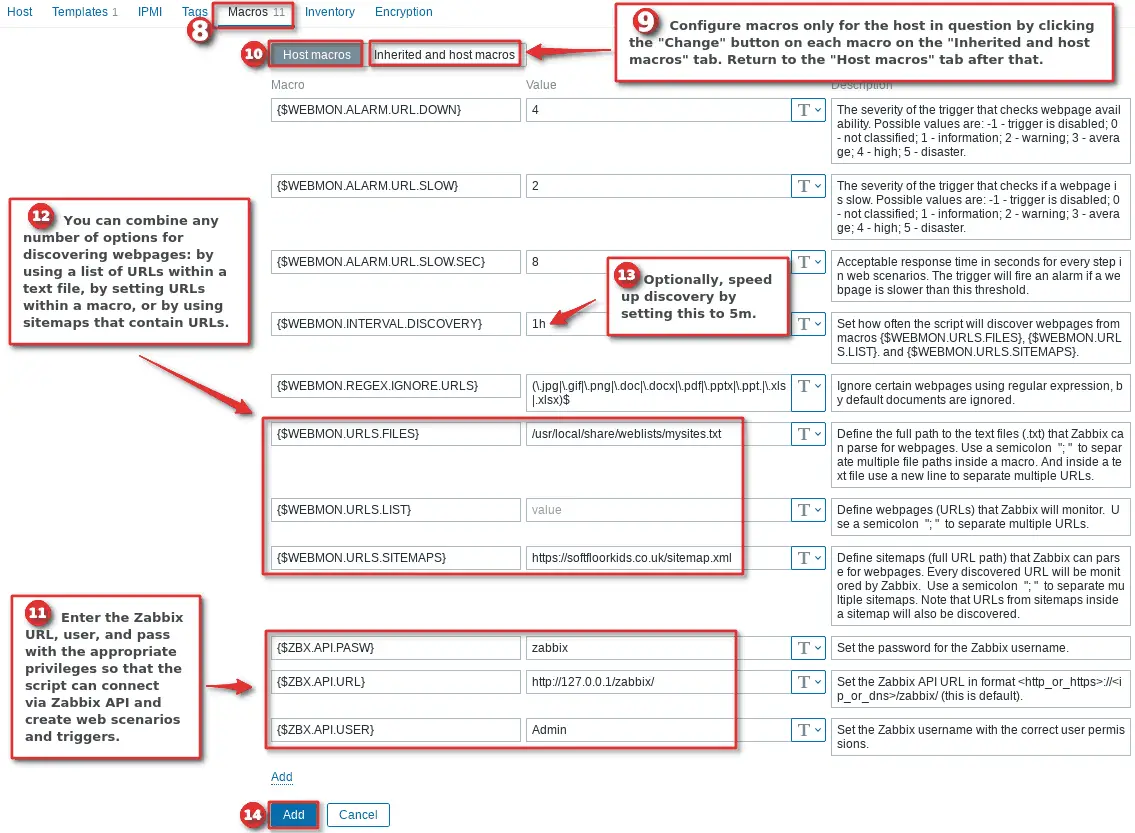
A few notes, if you want to monitor a few web pages, manually add URLs in the “{$WEBMON.URLS.LIST}” macro. However, if you monitor more than 3 URLs, then define the sitemap URL using “{$WEBMON.URLS.SITEMAPS}” macro or the full DIR path of the text file that contains a list of URLs using {$WEBMON.URLS.FILES} macro. Rember that you can combine any number of options or use just one!
Also don’t forget to set the correct user permissions if you are using the text file option, for example: “chown zabbix.zabbix /usr/lib/zabbix/externalscripts/sites.txt”.
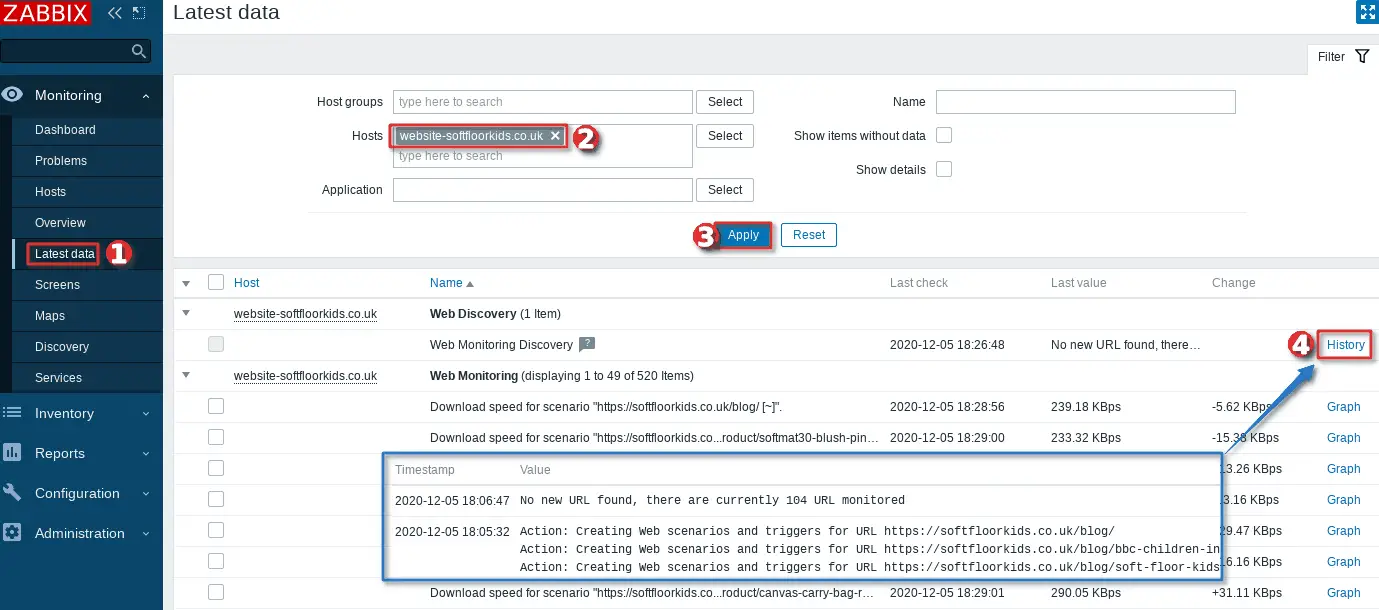
f) Check that the monitoring is working properly
To verify that monitoring is working properly, go to “Latest Information” in the “Monitoring” section and select your host in the “Hosts” field.
Want to receive email alerts when your website is down? Learn how to setup Zabbix email notifications and escalations!


В наш век всепоглощающих web-интерфейсов очень часто перед системными администраторами встаёт, на первый взгляд, непонятная с точки зрения объёмов задача: как проверять работоспособность сайта?
Практически все вспомнят про мониторинг 80/TCP (HTTP-версия) и 443/TCP (HTTPS-версия) портов web-сервера. Из них процентов 80% наверняка вспомнят, что с той стороны должен при этом трудиться Apache/NGINX обеспечивающий первоначальную работоспособность этого комплекса и т.д.
Службы (они же демоны) обеспечивающие работоспособность frontend и backend частей сайта обкладывать мониторингом безусловно надо. Но как быть, если в тех. поддержку поступает звонок с воплями «Ваш магазин отображает какую-то фигню, а я всего лишь хочу сделать заказ! Мне надо срочно!!! Почините немедленно!», а web-разработчики разводят руками и говорят «У нас всё нормально, это админы что-то с нашим прекрасным магазином сделали!».
Введение
Админ, помни — за тобой могут придти
Вроде бы понятное предупреждение, но все-таки хочется находится в кабинете в компании коллег, а не разъяренных начальников в компании с соседями из кабинета напротив.
Думаем на будущее
Прежде чем взять web-сервис на мониторинг, требуйте описание метрик его работоспособности, но при этом думайте шире повторяя как заклинание «Они наверняка что-то недоговаривают. Где-то возможны подводные камни». Паранойя не должна быть абсолютной, но в умеренном количестве жизненно необходима.
Рассмотрим пример с общедоступным всем в РФ сайтом поиска от Яндекс (yandex.ru).
Чтобы быть уверенным, что он открывается правильно, нужно знать, какие кусочки web-страницы не меняются ни при каких условиях и при этом отображаются только если он работает.
Так как лёгких путей мы не ищем, воспользуемся curl-ом с ключом «-v», потому что иначе мы не увидим важную для настройки мониторинга информацию:
$ curl -v yandex.ru
* Rebuilt URL to: yandex.ru/
*   Trying 5.255.255.80...
* TCP_NODELAY set
* Connected to yandex.ru (5.255.255.80) port 80 (#0)
GET / HTTP/1.1
Host: yandex.ru
User-Agent: curl/7.58.0
Accept: */*
HTTP/1.1 302 Found
Date: Wed, 25 Jul 2018 18:10:54 GMT
Cache-Control: no-cache,no-store,max-age=0,must-revalidate
Location: https://yandex.ru/
Expires: Wed, 25 Jul 2018 18:10:55 GMT
Last-Modified: Wed, 25 Jul 2018 18:10:55 GMT
P3P: policyref="/w3c/p3p.xml", CP="NON DSP ADM DEV PSD IVDo OUR IND STP PHY PRE NAV UNI"
Set-Cookie: yandexuid=7233814731532542254; Expires=Sat, 22-Jul-2028 18:10:54 GMT; Domain=.yandex.ru; Path=/
X-Content-Type-Options: nosniff
Content-Length: 0
* Connection #0 to host yandex.ru left intact
Итак, исходя из вывода curl-а мы можем вывести первый признак работоспособности. При запросе http://yandex.ru (то, что мы обращались к сайту по HTTP, свидетельствует 80-й порт в выводе) срабатывает переадресация по коду 302 на HTTPS-версию сайта.
Зачем это проверять, если оно и так должно работать?
Дело в том, что когда пользователь вбивает в адресной строке URL, ему фиолетово, через какой протокол он будет работать. Однако web-сервис на пару с его разработчиком могут придерживаться другого мнения на этот счёт.
Что-то еще или уже хватит?
Нет, не хватит. Мы же хотим быть уверенными, что переадресация ведет куда надо — раз. И два — при открытии https://yandex.ru напрямую (вдруг кто-то добавил страницу в избранное) сайт тоже должен нормально открываться.
Наконец-то настройка
Долго готовились, а теперь пора настроить то ради чего это все затевалось — мониторинг web-страниц Zabbix-ом.
Сразу оговорюсь — в этом руководстве я исхожу из того, что у вас уже есть настроенный узел сети (он же host), в который надо просто добавить web-сценарий проверки.
Дальше будет много скриншотов.
Настраиваем сценарий (задаем имя сценария, частоту проверки и при необходимости иные параметры)
Создаем шаги:
Первый шаг — запрещаем переход по редиректам и проверяем код ответа
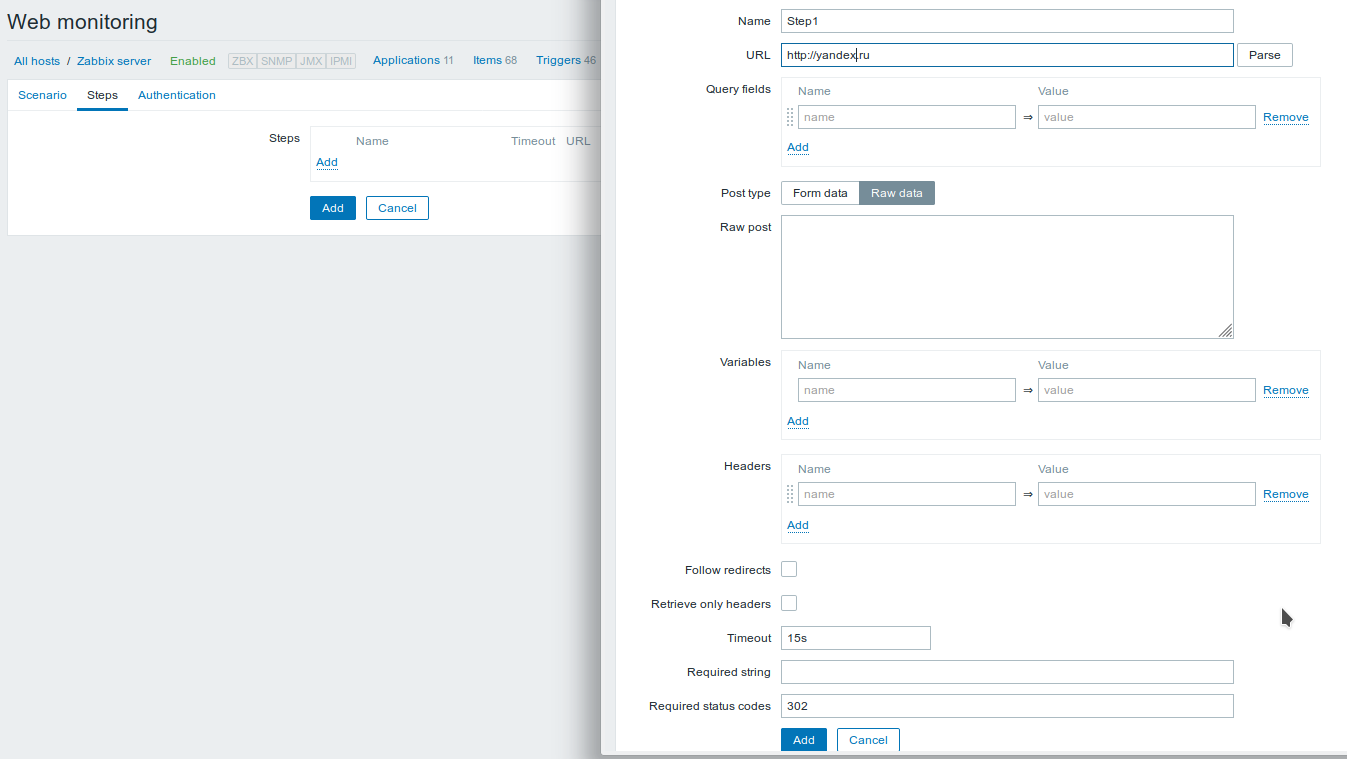
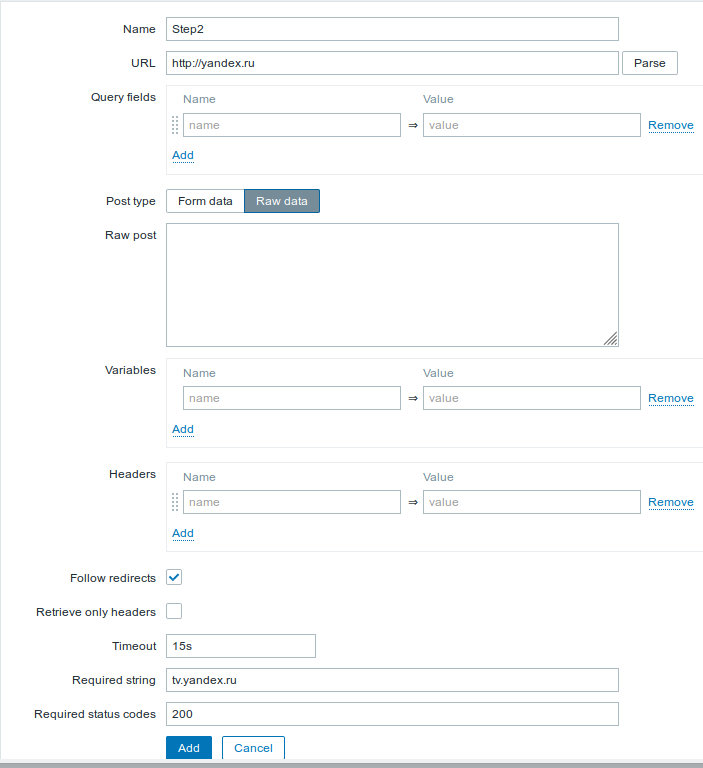
Второй шаг — тоже что и выше, но теперь разрешаем редиректы и помимо кода ответа проверяем наличие какой-то строки, которая укажет на то, что страница загружается штатно.
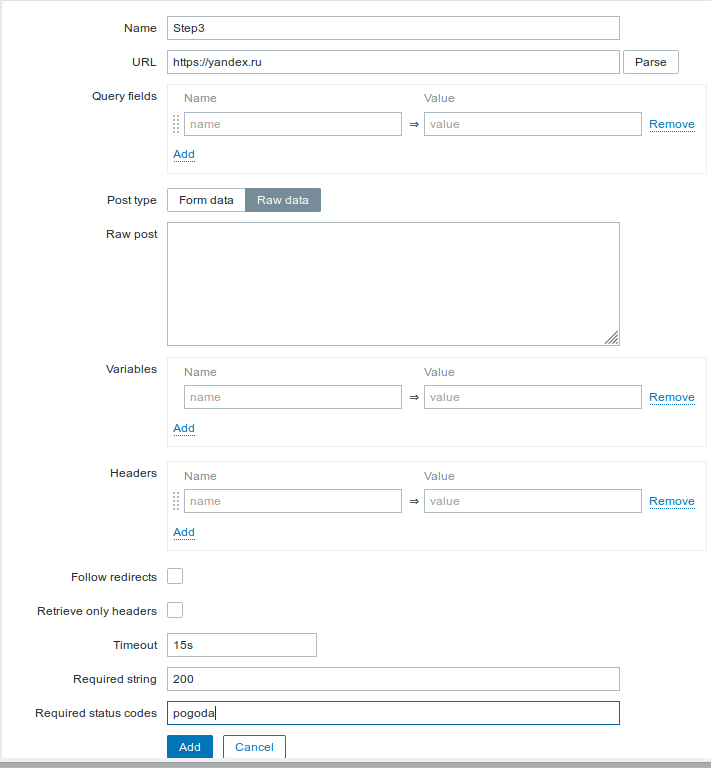
Третий шаг — запрещаем переходы по редиректам и проверяем HTTPS версию (код ответа и наличие строки указывающей на работоспособность сайта)
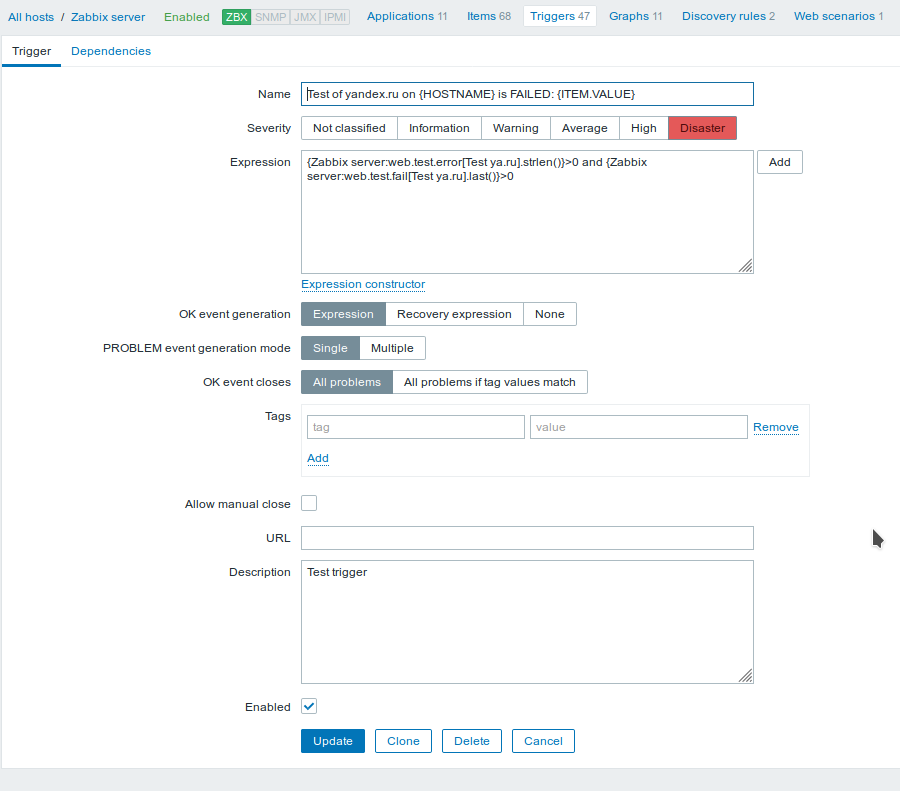
Теперь создадим триггер, который проверяет, что сценарий отработал успешно.
Коротко суть:
1) ITEM.VALUE указатель на первое из двух выражений триггера (если нужно использовать несколько выражений или конкретное по номеру, то нужно использовать порядковые номера. Например — ITEM.VALUE3);
2) Выражения триггера — первое проверяет на что сообщение об ошибке не пустое, а второе что номер проваленного шага не 0 (если 0, значит проверка завершена успешно).
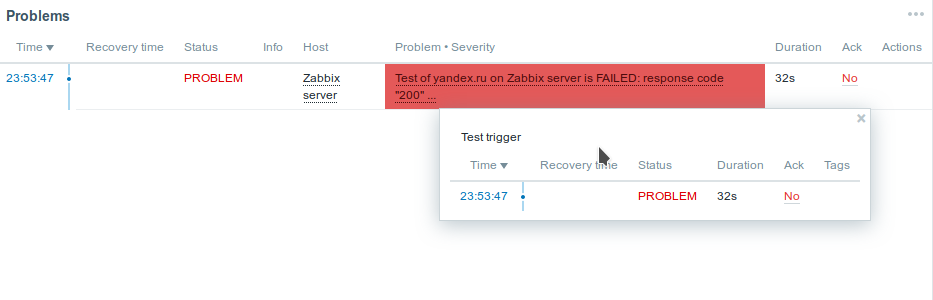
Если вдруг триггер сработает, то выглядеть это будет примерно вот так (для проверки я изменил один из ожидаемых кодов ответа в сценарии на заведомо неверный):
Вообще это очень гибкий инструмент Zabbix-а. Из сложного вспоминается возможность выполнения WSDL-запросов с авторизацией на целевом сервере по SSL-сертификату, но по понятным причинам типовых сценариев использования таких возможностей нет.
Напоследок
Настройка мониторинга — задача в каком-то смысле творческая. Не запирайте себя в шаблонах и всегда ищите новые возможности использования имеющихся инструментов.
Есть вопрос? Напишите в комментариях!
Продолжаю свой цикл статей по настройке системы мониторинга на базе популярного бесплатного продукта. В этот раз мы подробно рассмотрим вопрос настройки мониторинга web сайта в подготовленном ранее zabbix сервере. В качестве примера возьмем какой-нибудь сторонний ресурс и проверим на нем предложенный стандартный функционал.
Содержание:
- 1 Введение
- 2 Добавление web сайта к мониторингу
- 3 Создание сценариев проверки сайта
- 4 Настройка графиков мониторинга веб сайта
- 5 Оповещение о недоступности сайта
- 6 Заключение
- 7 Дополнительные материалы по Zabbix
Введение

Для мониторинга веб сайта мы будем использовать стандартный функционал zabbix. Вот параметры, за которыми будем наблюдать:
- доступность сайта
- время ответа сайта в миллисекундах
- скорость доступа к сайту
Для этого мы выполним следующую последовательность действий:
- Добавим наблюдаемый сайт в систему.
- Настроим сценарии проверки.
- Создадим графики с данными.
- Добавим триггер на проверку доступность сайта.
Приступаем к настройке мониторинга. Использовать будем только стандартный функционал, доступный после установки. Никаких дополнительных пользовательских параметров или работы скриптов не будет.
Если у вас еще нет своего сервера для мониторинга, то рекомендую материалы на эту тему. Для тех, кто предпочитает систему CentOS:
- Установка CentOS 7.
- Настройка CentOS 7.
- Установка и настройка zabbix сервера.
То же самое на Debian 9, если предпочитаете его:
- Установка Debian 9.
- Базовая настройка Debian 9.
- Установка и настройка zabbix на debian.
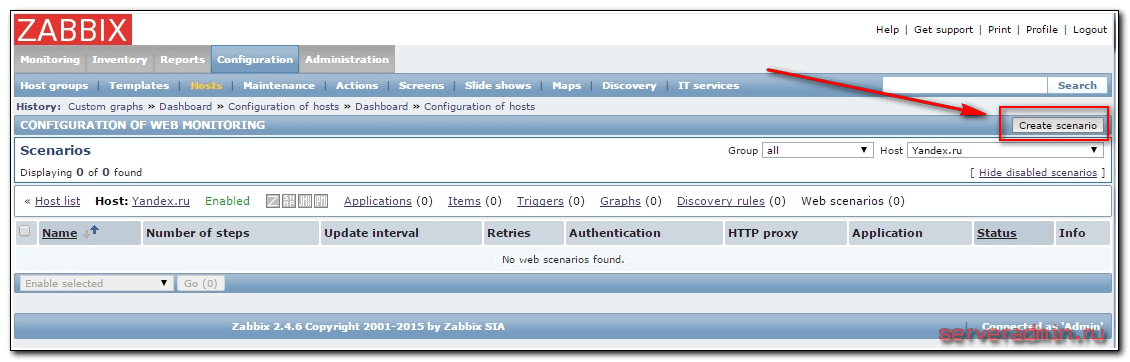
Добавление сайта принципиально не отличается от добавления любого другого хоста. Идем в Configuration -> Hosts и жмем Create host:
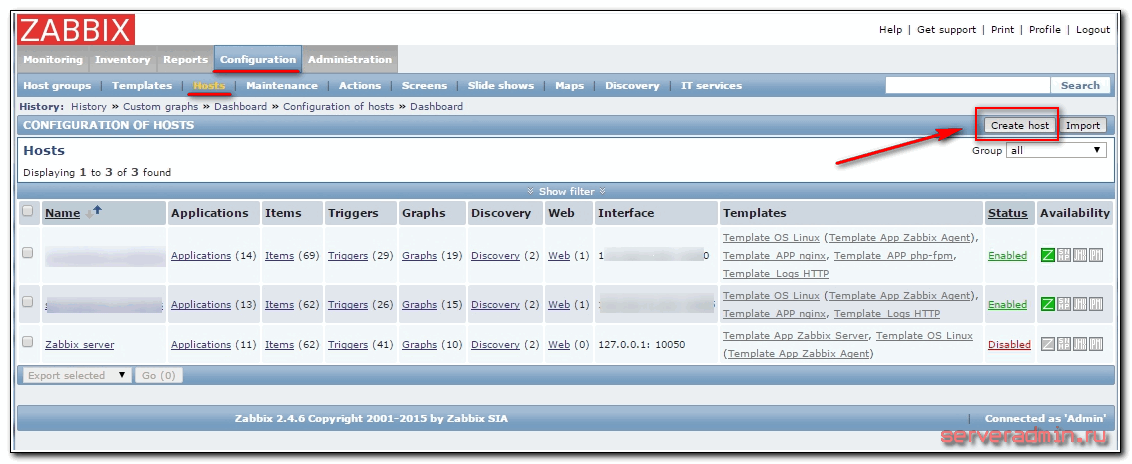
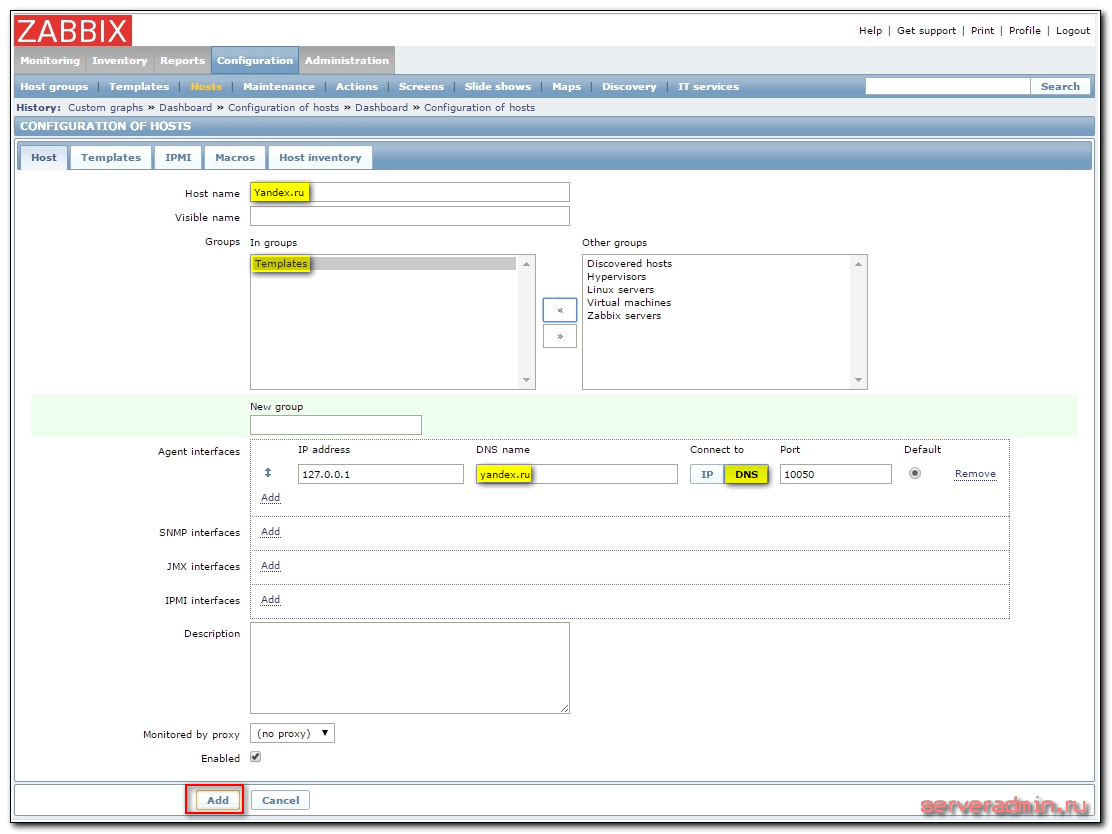
Открывается стандартная форма. Вводим название хоста. Выбираем любую группу, для удобства лучше создать отдельную для сайтов. У меня ее нет, я просто выбираю группу Templates. Для примера будем мониторить сайт yandex.ru. В поле DNS name пишем yandex.ru, все остальное оставляем как есть и жмем Add:
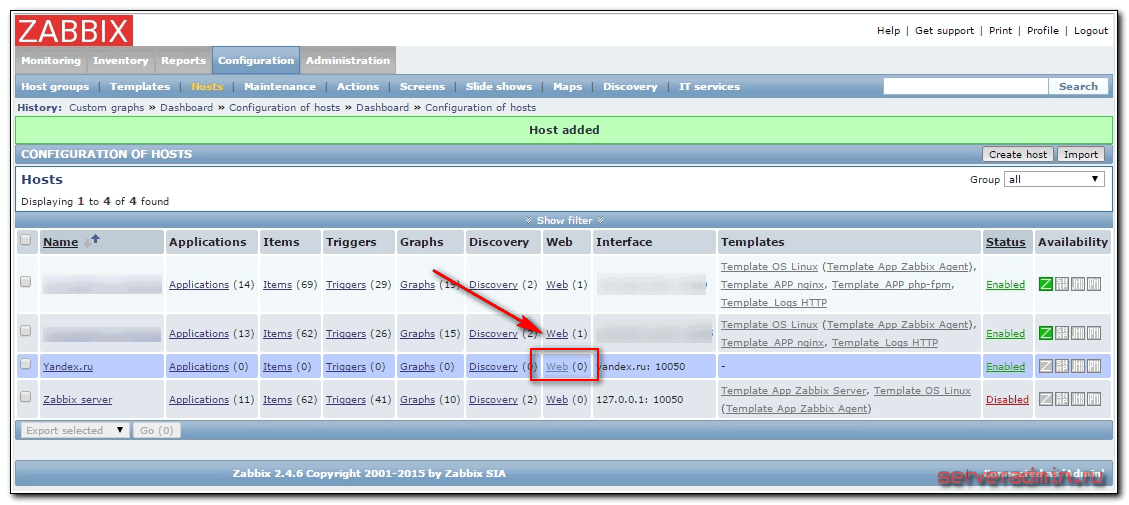
В списке хостов появился новый с именем Yandex.ru.
Создание сценариев проверки сайта

Теперь нам необходимо настроить непосредственно сам мониторинг сайта. Для этого на той же странице со списком хостов, напротив нашего нового нажимаем на ссылку Web:
В разделе web сценариев у нас пусто, создаем новый сценарий проверки, нажав на Create scenario:
На первой вкладке Scenario заполняем необходимые поля:
- Имя сценария.
- Интервал проверки.
- Агент, от имени которого будет выполняться проверка:
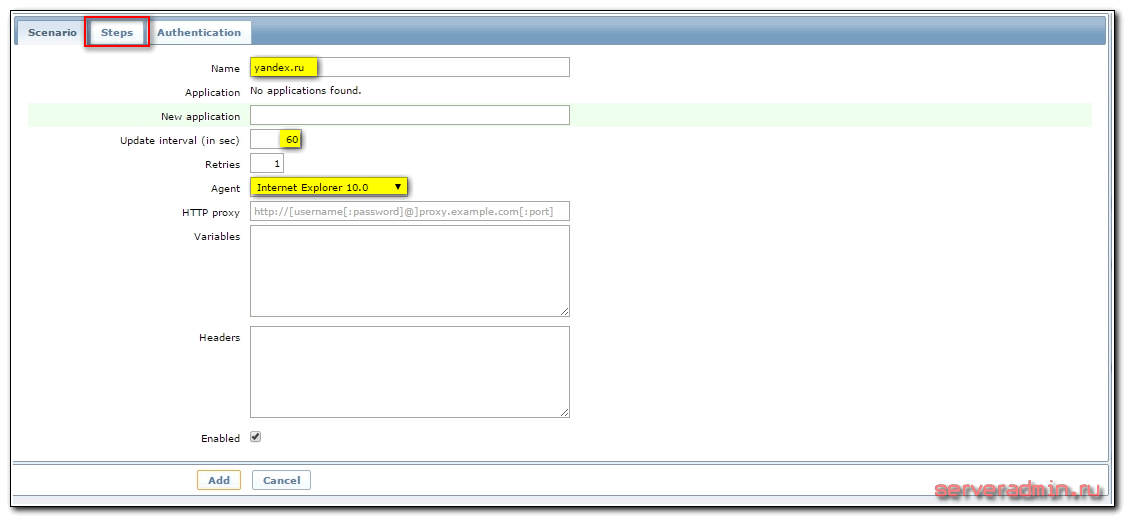
Переходим на вкладку Steps и нажимаем там на Add. Откроется форма, заполняем ее. Указываем:
- Имя шага сценария.
- Адрес страницы для проверки.
- В строку Required string вводим какое-нибудь слово или фразу, которая присутствует на проверяемой странице. По наличию этой фразы система будет принимать решение о доступности сайта. Возьмем для примера слово Яндекс, которое присутствует в правом нижнем углу сайта.
- Указываем необходимый код ответа сервера, который будет означать, что все в порядке — 200:
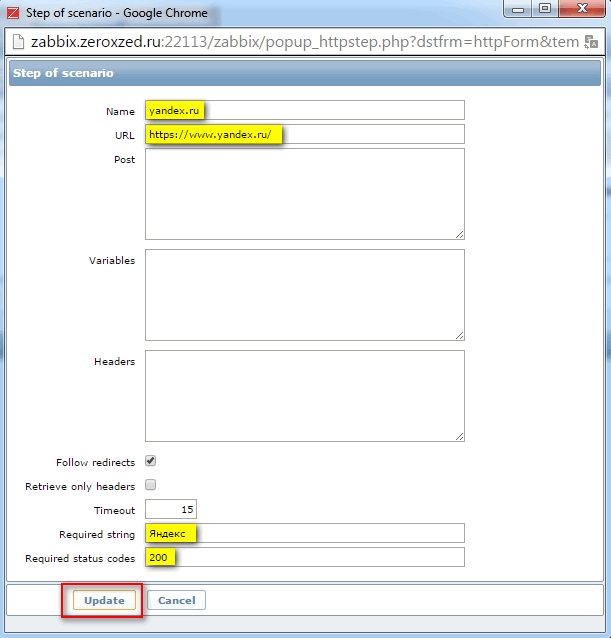
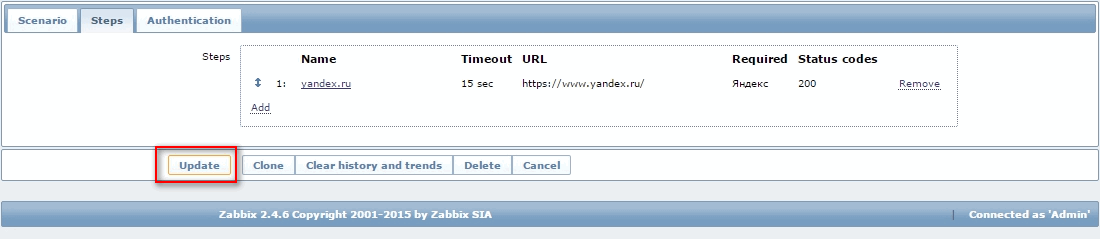
Нажимаем Update. Шаг сценария добавлен, теперь нажимаем Update еще раз на странице самого сценария, чтобы добавить его к сайту:
Теперь нужно подождать пару минут, чтобы стали поступать новые данные проверки. Посмотреть их, как обычно, можно в разделе Monitoring -> Latest data. Выбираем наш хост и проверяем данные мониторинга:
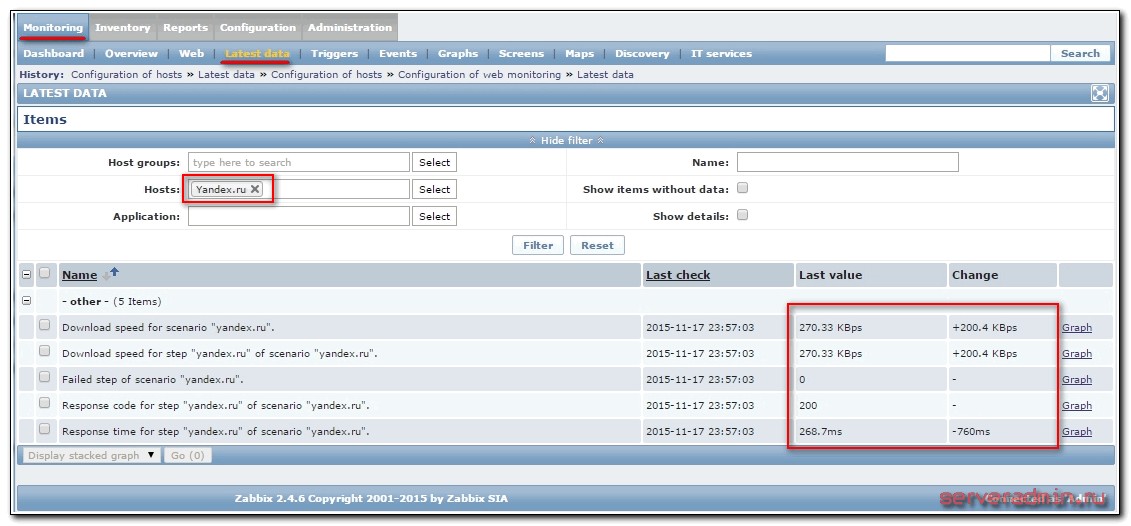
Все в порядке, данные стали поступать. Теперь для удобства отобразим их на графике.
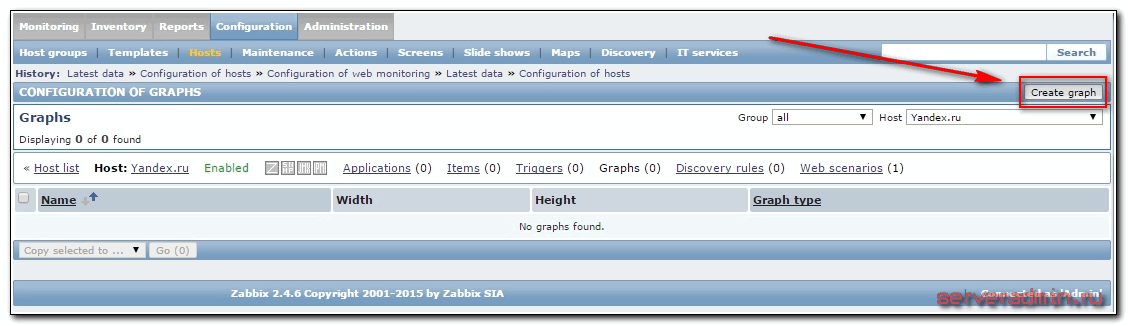
Настройка графиков мониторинга веб сайта
Тут нет ничего нового, все, как обычно. Идем снова в Configuration -> Hosts и жмем Graphs напротив нашего хоста:

Нажимаем на Create graph:
И заполняем необходимые поля:
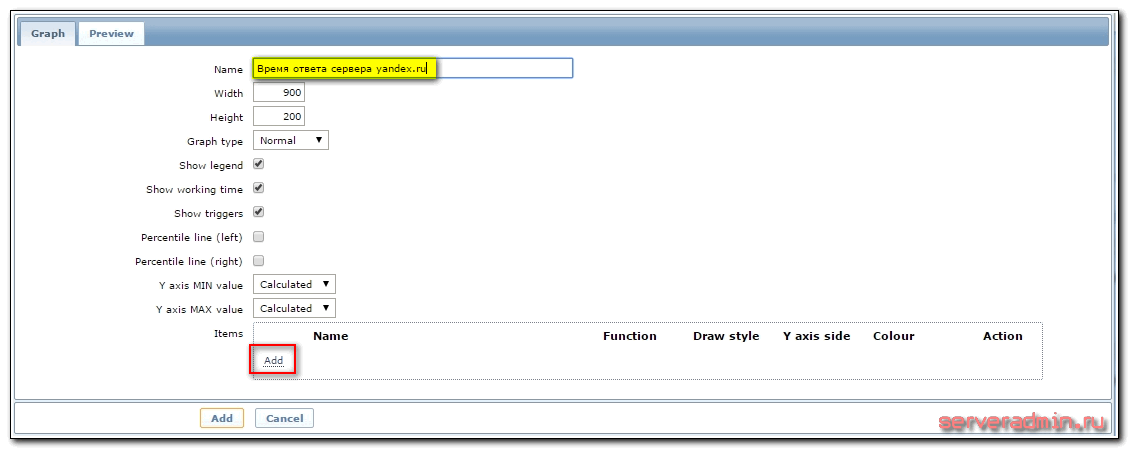
Нажимаем на Add и добавляем источник данных:
Можете сами поиграться с параметрами графика и выбрать то, что вам больше подходит. Я оставлю все стандартное, хотя нужные мне графики я аккуратно рисую, чтобы было более наглядно и удобно пользоваться. Должно получиться примерно так:
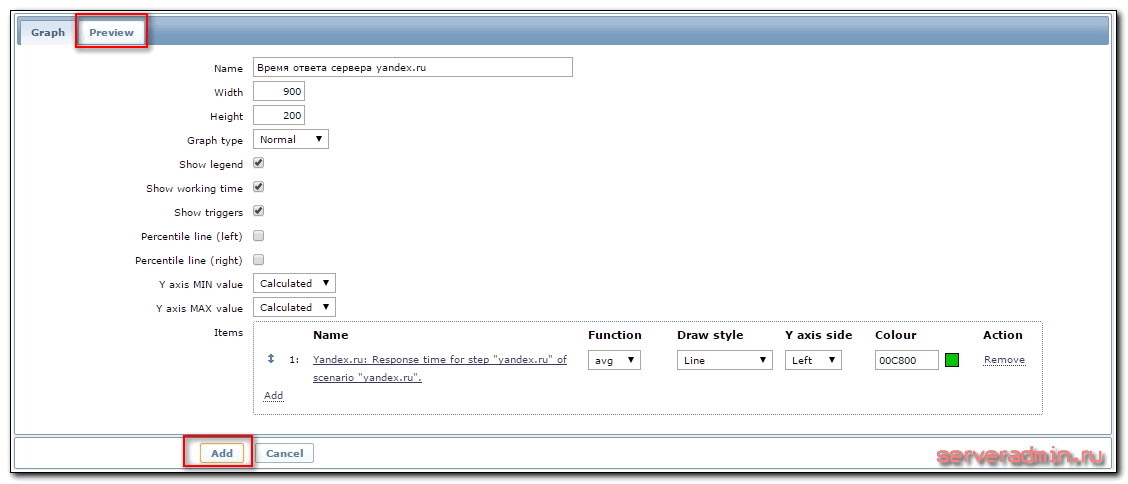
Посмотреть на график можно тут же на вкладке Prewiew. Когда закончите с настройкой, нажимаете Add.
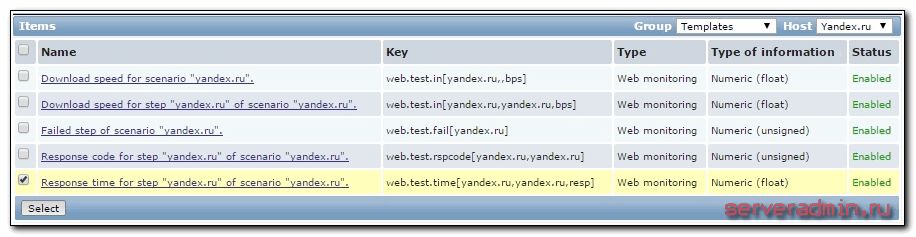
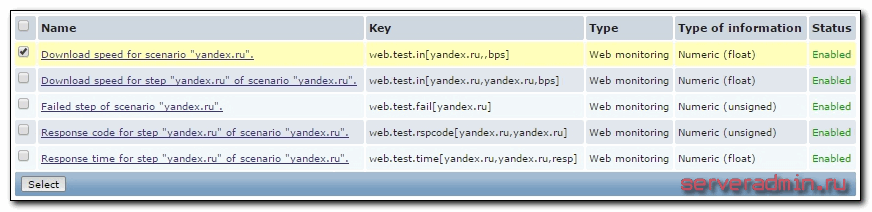
По аналогии добавляете график скорости доступа к сайту, выбирая в качестве источника данных Download speed for scenario «yandex.ru»:
Полезного тут больше нечего рисовать. Двух графиков достаточно.
Оповещение о недоступности сайта

Теперь добавим триггер, который будет срабатывать при недоступности сайта. Чтобы получать оповещения об этом событии, их необходимо настроить. Как настроить оповещения zabbix на email я рассказывал отдельно. Рекомендую ознакомиться и сделать соответствующие настройки. Эту тему я не буду сейчас поднимать, переходим сразу к реализации.
Опять идем в раздел Configuration -> Hosts и нажимаем на Triggers напротив нашего хоста. Открывается стандартная страница с пустым списком, нажимаем справа Create trigger:

Заполняем необходимые поля:
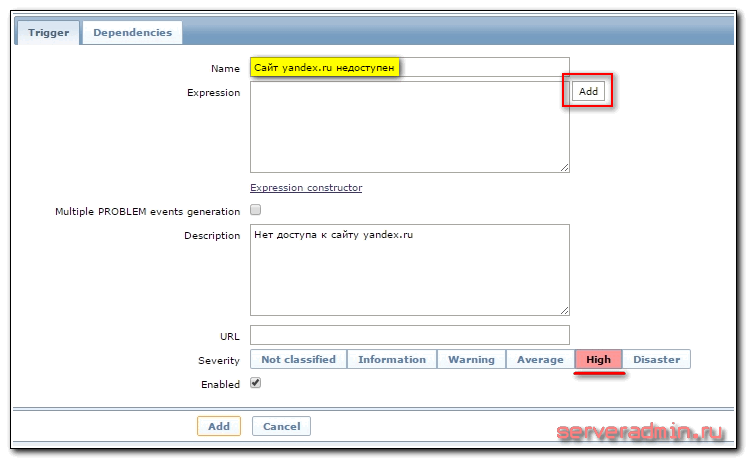
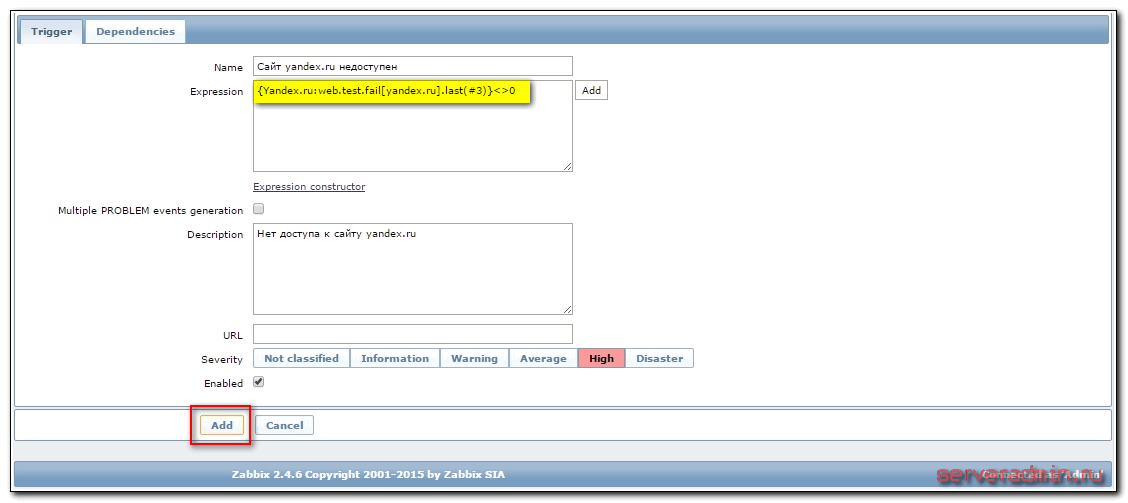
И жмем напротив Expression на кнопку Add. Открывается форма для описания триггера. Заполняем, как показано на картинке:
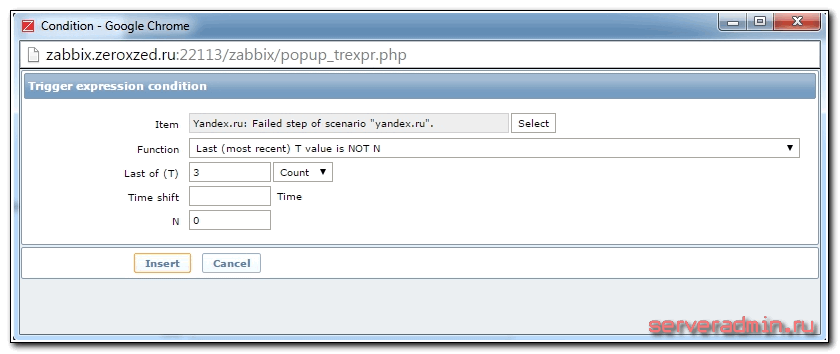
Эти параметры означают, что если в последних трех проверках значение параметра web.test.fail не будет равно 0, что означает доступность сайта, то срабатывает триггер. Проверяем данные и жмем Add:
Теперь нам нужно проверить работу триггера. Для этого надо сделать сайт yandex.ru недоступным. Я просто зайду на сервер и добавлю в файл hosts строку:
127.0.0.1 yandex.ru
Вы можете выбрать какой-то еще способ. Если это ваш сайт, можете его погасить для теста ?
Странно, но способ с hosts у меня не сработал. Не знаю почему, не стал долго разбираться. С консоли сервера я не мог скачать страничку яндекса, но заббикс каким-то образом это делал. Не помог даже его перезапуск. В итоге пришлось просто на время отключить dns сервер, чтобы добиться срабатывания триггера.
Ждем прохождения трех проверок и проверяем. Для этого открываем Dashboard и смотрим на статусы хостов:
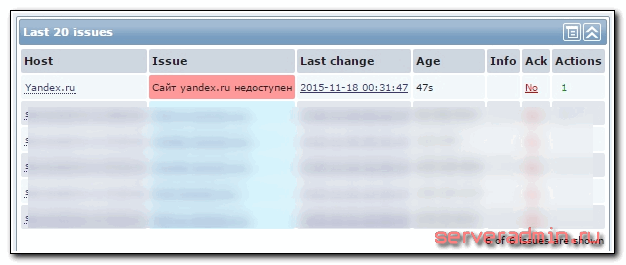
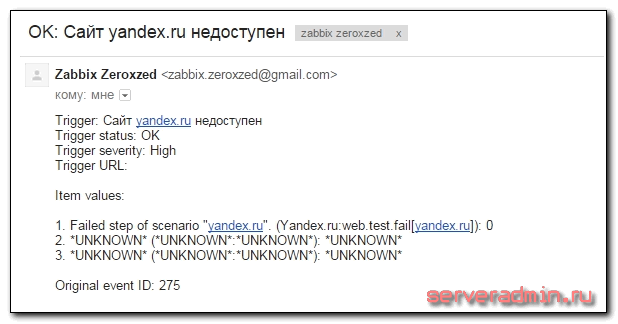
Все в порядке, триггер сработал. Я включил обратно dns сервер, и стал ждать следующего срабатывания с информацией о восстановлении соединения. Все в порядке, триггер сработал еще раз и мне прилетело на почту об этом уведомление:
Вот и все, мониторинг веб сайта работает, параметры доступа фиксируются, оповещение о доступности сайта настроено. Для полноты картины можно создать Screen с выводом всех необходимых параметров на один экран. Его настройки уже будут зависеть от конкретной ситуации и тех данных, которыми вы располагаете. К примеру, если у вас настроен мониторинг веб сервера, то можно разместить рядом графики его загрузки и параметры доступа к сайту. Туда же можно добавить загрузку самого сервера по процессору и памяти и вывести график использования сетевого интерфейса.
В этом плане Zabbix очень гибок и позволяет настроить все на любой вкус и под любые требования.
Более подробно о мониторинге за временем отклика сайта читайте в отдельной статье на этот счет. Там описана теория процесса и практические рекомендации, вместе с готовым триггером.
Заключение
Добавлю несколько слов, как можно использовать данный мониторинг web сайта. У меня было два хостинга и хотелось выбрать один более быстрый. Загрузка самого сервера по железу была настолько низка, что ее можно было вообще не брать в расчет. Более важным параметром было именно время отклика сервера и скорость доступа к нему. Я запустил сайт на обоих серверах и настроил мониторинг. По его параметрам выбрал более быстрый сервер.
Конечно, тут нужно понимать, что данные подобного мониторинга очень условны и зависят о того, где располагается сам сервер заббикса. Возможна ситуация, когда мониторинг всех сайтов будет показывать примерно одни и те же цифры из-за ограничения самого сервера мониторинга. Нужно иметь это ввиду. Еще достаточно часто при проверке времени отклика сайта появляются большие провалы по времени до 5-10-15 секунд. Это сильно влияет на среднее время доступа. Возникают эти провалы из-за временных сетевых проблем не обязательно на самом сайте. Это тоже нужно учитывать при анализе полученных данных.
В любом случае нужно с головой подходить к анализу данных мониторинга сайта. В большинстве случаев важны не сами значения, а общие тенденции их изменения в сравнении и с другими хостами. Учитывайте это. На этом у меня все.
Zabbix — Мониторинг веб-сайта
Zabbix — Мониторинг веб-сайта
Хотите узнать, как настроить Zabbix веб-мониторинг? В этом уроке мы покажем вам, как отслеживать веб-сайт с помощью Zabbix и функции веб-сценария.
Список оборудования
Здесь вы можете найти список оборудования, используемого для создания этого учебника.
Эта ссылка будет также показать список программного обеспечения, используемого для создания этого учебника.
Заббикс плейлист:
На этой странице мы предлагаем быстрый доступ к списку видео, связанных с установкой Забфикса.
Не забудьте подписаться на наш канал YouTube под названием FKIT.
Заббикс Связанные Учебник:
На этой странице мы предлагаем быстрый доступ к списку учебников, связанных с установкой Забфикса.
Учебник Zabbix — Мониторинг веб-сайта
Откройте браузер и введите IP-адрес вашего веб-сервера плюс /zabbix.
В нашем примере в браузер был введен следующий URL::
• http://35.162.85.57/zabbix
На экране входа используйте имя пользователя по умолчанию и пароль по умолчанию.
• Default Username: Admin
• Default Password: zabbix

После успешного входа, вы будете отправлены на панель мониторинга зайбит.

На экране панели мониторинга получите доступ к меню Configuration и выберите опцию Host.

Найдите и нажмите на хост с именем: ZABBIX СЕРВЕР
На экране свойств хоста получите доступ к вкладке Приложения.
В правой верхней части экрана нажмите на кнопку «Создание приложения».
На экране Ведущие приложения создайте новое приложение с именем WEBSITE.

После завершения создания приложения перейдите на вкладку Веб-сценарии.
В правой верхней части экрана нажмите на кнопку Создать веб-сценарий.
На экране веб-сценария необходимо настроить следующие элементы:
• Имя: Введите идентификатор веб-сайта.
• Применение: Веб-сайт
• Интервал обновления: 1 минута
• Агент: Zabbix
Включено: Да

Откройте вкладку Шаги и Добавьте новый шаг.

Необходимо настроить следующие элементы:
• Имя: Введите удостоверение личности.
• URL: Введите URL-адрес веб-сайта
Последующие перенаправления: Да
• Требуйте код состояния: 200

Нажмите кнопку Добавить и завершите настройку веб-сценария.
Подождите 5 минут.
Чтобы протестировать конфигурацию, получите доступ к меню мониторинга и нажмите на опцию «Последние данные».

Используйте конфигурацию фильтра для выбора хоста Zabbix сервера.
Используйте конфигурацию фильтра для выбора приложения Веб-сайт.
Нажмите на кнопку применить.

Вы должны иметь возможность видеть результаты мониторинга вашего сайта с помощью Zabbix.

Поздравляю! Вы настроили Zabbix для мониторинга веб-сайта.
VirtualCoin CISSP, PMP, CCNP, MCSE, LPIC22022-02-19T19:59:19-03:00
Related Posts
Page load link
Join Our Newsletter

Ok